Vector Analysis
The program ArcGIS Online offers a wide variety of data available for mapping. It also provides a simple arrangement of useful tools to edit and arrange this data accordingly to achieve a desired map that can be then shared publicly with the click of a button. In this case, ArcGIS Pro and ArcGIS Online were used to create a choropleth map and a kernel density map of the number of apple trees in Utrecht.
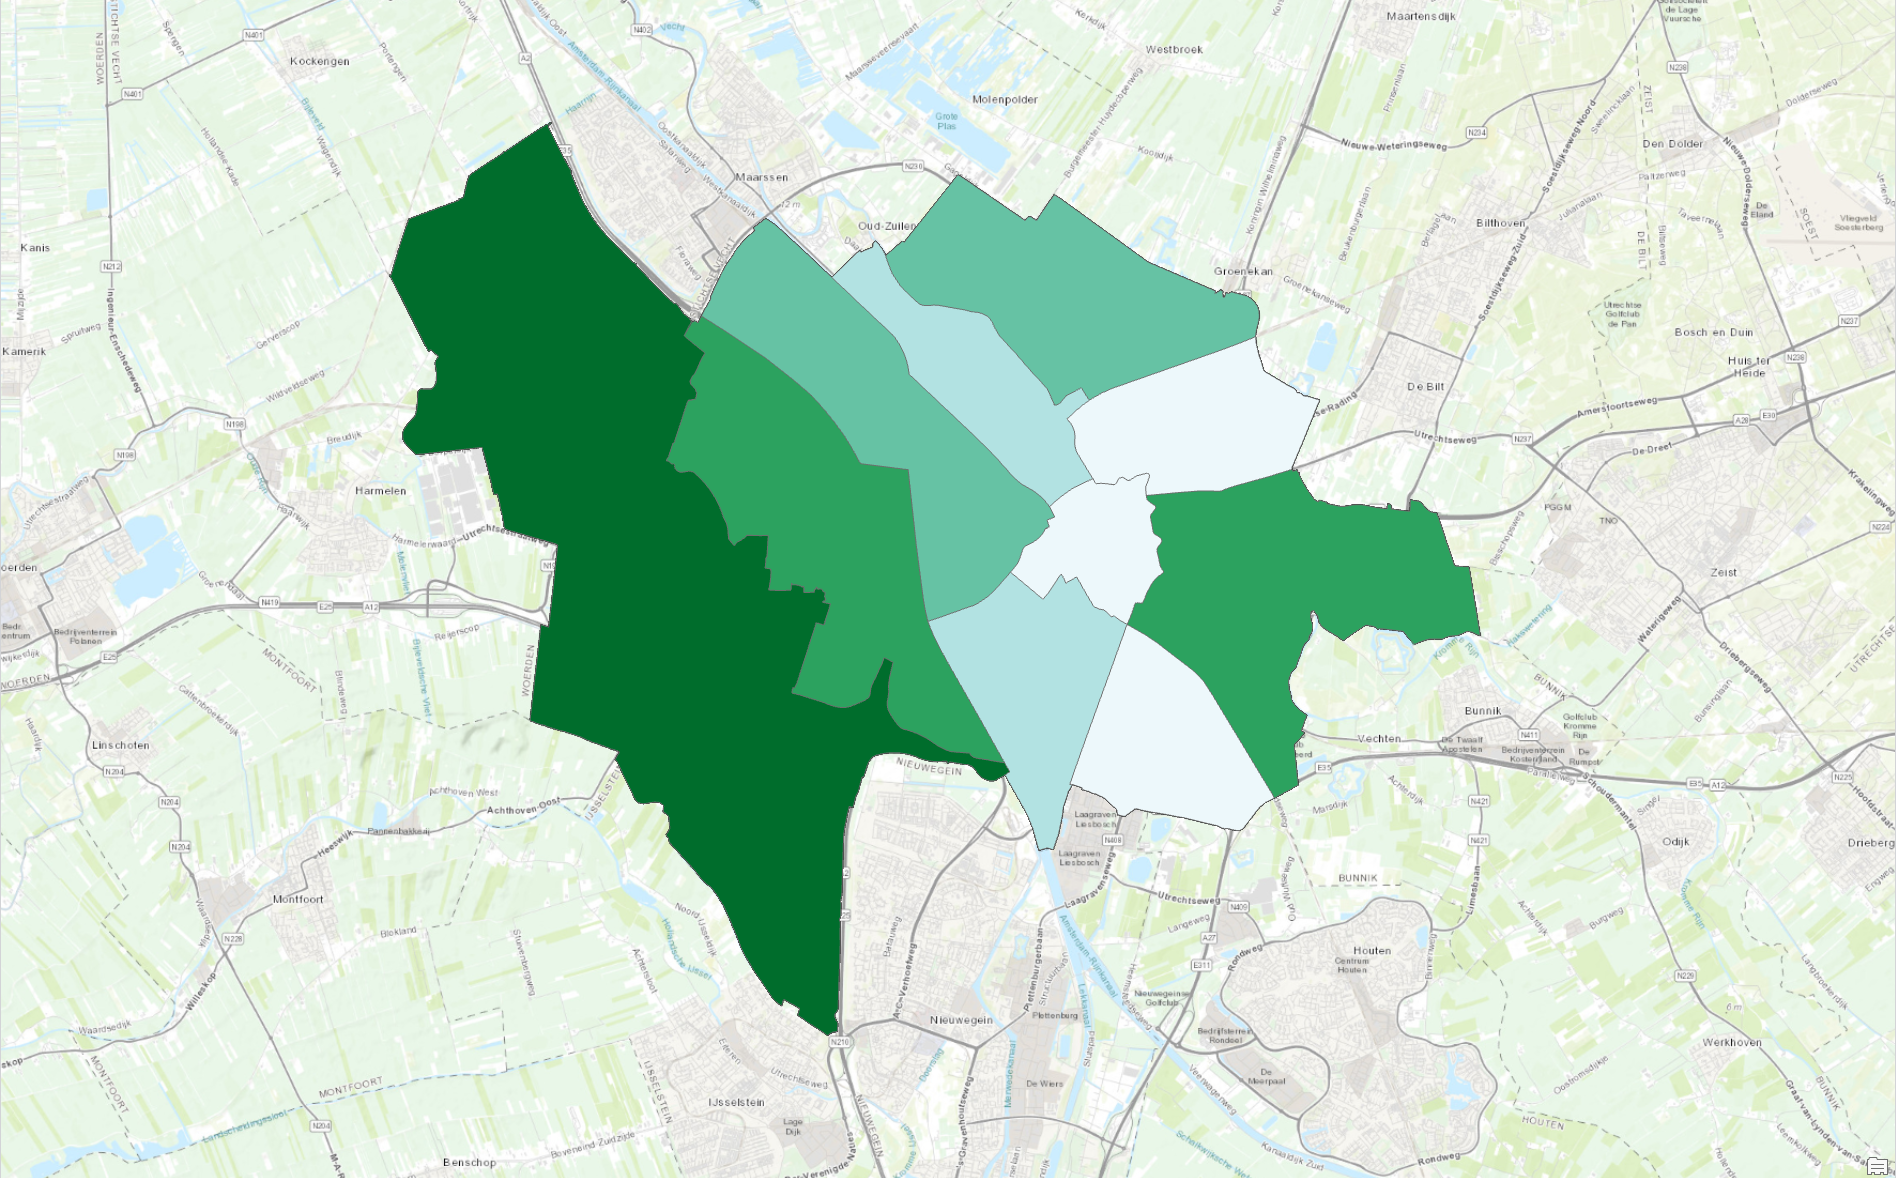
The maps in this page were created from the bonenkaart of Utrecht 2024 and the information of the different neighbourhoods. Once the data was downloaded from ArcGIS online, the apple trees were isolated from the general tree population. By creating a separate layer, this data was measured and used to map the amount of apple trees in utrecht by neighbourhood in the form of a choropleth map.
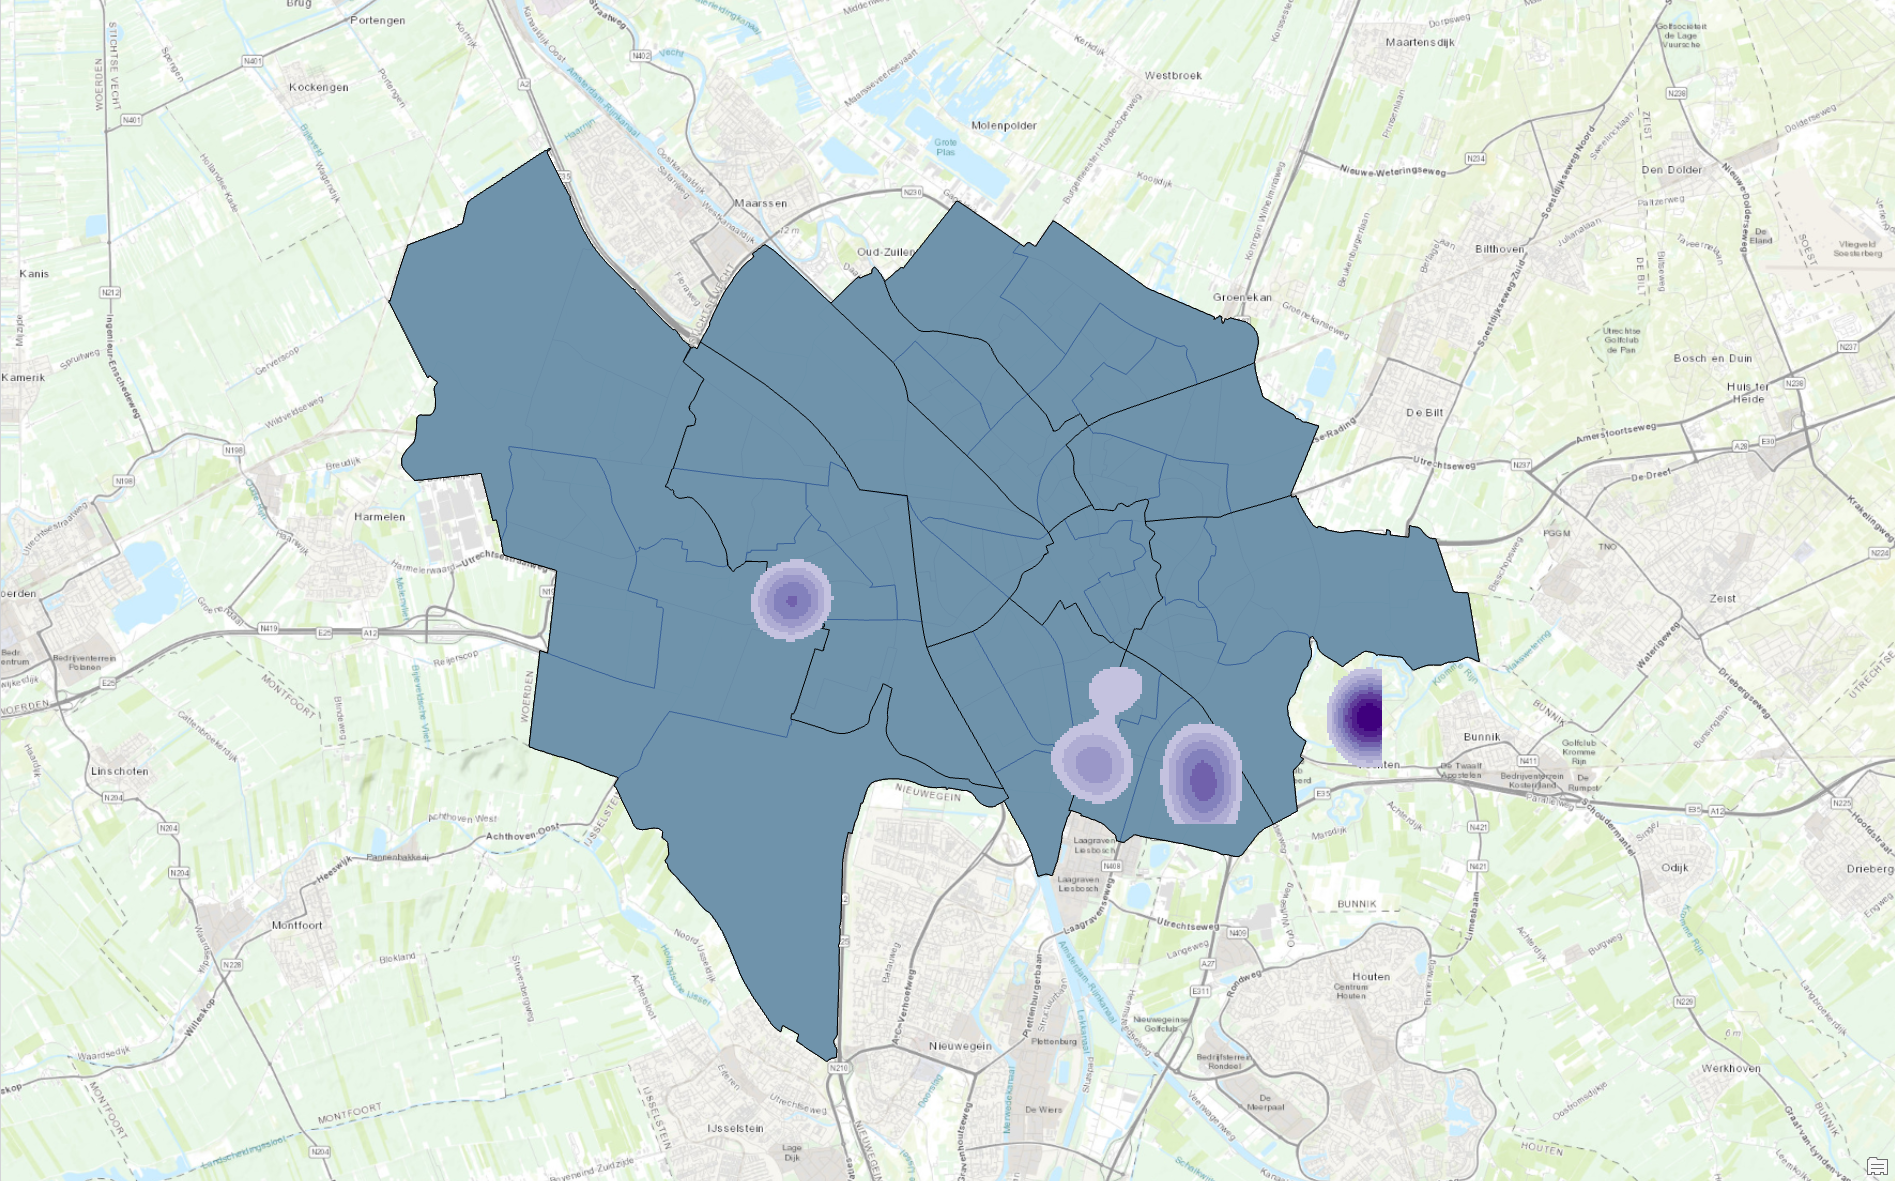
When duplicated, this layer was then turned into a kernel density map by using the toold in ArcGIS Pro. This kernel density map provides a visual representation of where the highest concentration of apple trees in Utrecht are located. Therefore, this map is useful in determining what areas are most likely to contain apple trees.